
I’ve always had a problem with statistics, specifically, the number of people partaking in an activity. We see these numbers all the time in the news. “3 million people did this,” and “134 million people did that.” The problem is that there isn’t a broader context that helps us make sense of the numbers. This is the most misleading when people are talking about historical attendance numbers. Why? Because the population of the United States increases every year.
Videos by Outdoors with Bear Grylls
At the beginning of each year, we see articles about park visitation numbers, with many of them boasting about record visitation. But, if the population is always rising, we’d expect to see more people visiting the parks anyway, so the numbers aren’t as exciting as they look. For example, we were just told that “2019 was the third most visited year for national parks since 1904.”
However, when you cross-reference the national park visitation number with population growth, you get a very different story.
For me, a far more interesting statistic is the percentage of people partaking in a particular activity. Without this extra information, I don’t know how popular the activity is. When I cross-referenced national park visitation with population growth from the U.S. Census Bureau, an interesting statistic emerged.
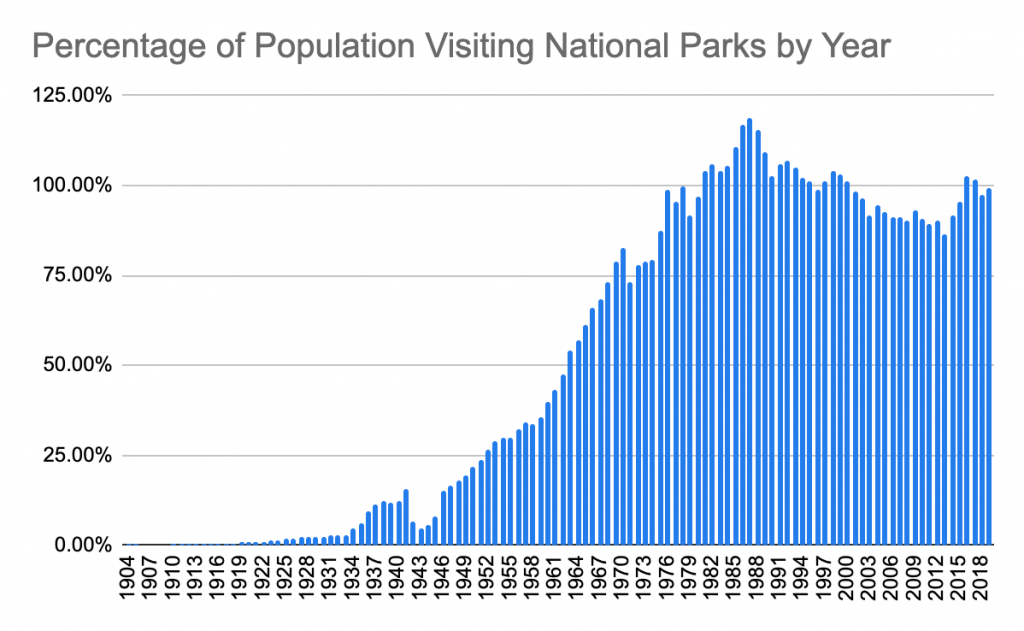
1987 is actually the most popular year for National Parks (not 2016).
2016 was the centennial celebration for the NPS, and they saw record visitation numbers that year, with 102% percent visitation in relation to the population. So, many people visited more than once, which is normal. However, 1987 saw a 118% visitation rate, relative to the population. Simply put, visiting National Parks was more widespread in 1987 than it was in 2016. In fact, the late-80s are at the top of the list, with 1985-1989 coming in ahead of the entire century.
There are a few other interesting observations when you view national park visitation from this vantage point. Note: when I use a percentage, I’m referring to the percentage of the population visiting National Parks annually.
We didn’t see a decline in park usage during the Great Depression. We saw pretty much the same amount of usage from 1929 to 1933, and it continued to rise until the end of the depression in 1939. This surprised me, but perhaps it shouldn’t have. Visiting parks and camping can be a very cheap excursion if you want it to be. You can grab food from the refrigerator along with an old tent, put a few bucks in the gas tank, and head out.
World War II took the place of everything. The United States’ involvement in WWII was 1941 – 1945. In 1942 the percentage drops in half, from 15% to 7%. Then, from 1945 to 1946 we see it double again, with annual visitation going from 10 million to 20 million visitors.
Visitation dropped 10% in 1970 and didn’t recover until 1975. The United States lost the most lives in the Vietnam War in the late 60s – about 65% of all casualties. The relationship between the national mood and recreation seems to play out here just as it did during WWII. Our involvement ended in 1975, and that year saw an increase of 20 million visitors from 1974 (and a 10% increase relative to population).
So what’s the deal with 1987?
Why did we see the highest percentage of people visiting national parks of all time? I’m not an economic expert, so I’m not really sure. We did have substantial growth in the GNP from 1982 – 1987, which created 13 million new jobs, and more disposable income generally means more travel.
Do you know what I think is responsible? Holiday Road. That’s right, the theme song from National Lampoon’s Vacation, which hit the theatres in 1983. It’s one of the best road trip movies of all time. The entire country had that song stuck in their heads for four years, compelling them to pack the station wagon and hit the road every chance they got. It’s entirely plausible, and it’s the soundtrack I’m going to use to plan my summer road trips this afternoon.

